
Active Learning for Chemical Engineering Students and Faculty Members Based on a Psychrometric Charts Teaching Module
- English
- Türkçe
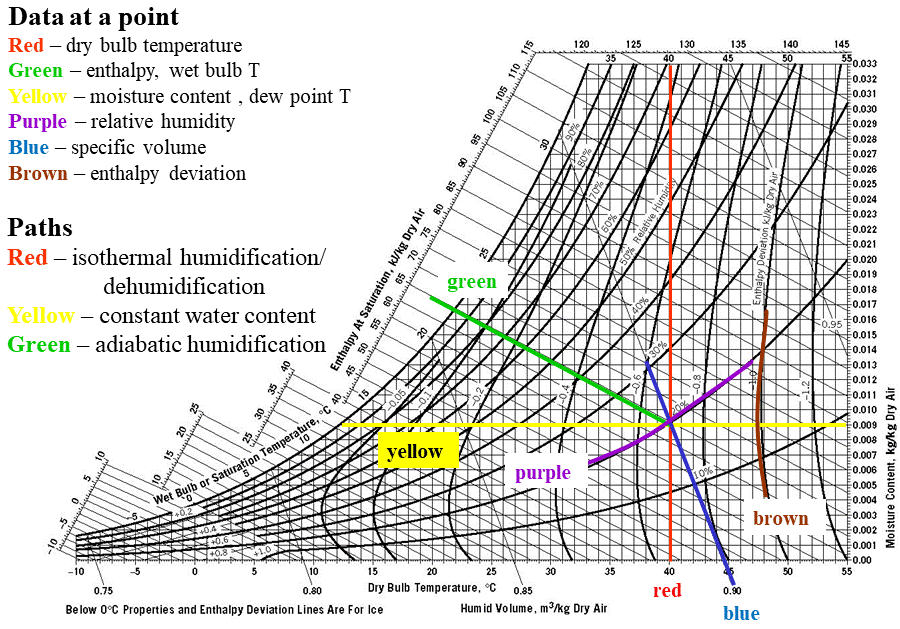
Psychrometric charts are useful for cooling towers, dryers and humidifiers. In chemical engineering undergraduate curriculum psychrometric charts are taught and used in material and energy balances and separation processes courses. The charts contain 6 layers of lines, 8 sets of data and three thermodynamic paths. The vast number of information on these charts make them confusing for the new learners. We designed an active learning module to teach psychrometric charts which allows the students to engage with the charts closely while colour coding the data. This active learning exercise also forms a basis for faculty members who would like to introduce an active learning exercise into their courses. The details of setting up an active learning exercise is given in the article in detail.
In teaching psychrometric charts, we hand out a copy of the chart to every student and a set of pencils of 6 different colours to every 4-5 students. A copy of the chart is also projected to make all details clearly visible for everyone. Then one line representing a data set in a specific colour shows up on the projected chart and students are asked to colour their own chart. The colour and the data it represents is also written in the legend on the chart. This is followed by colouring all the other data sets and thermodynamic paths one by one. Figuring out each data set on the chart and its meaning is much easier for the students as they do that in steps and by actively working on the chart. The questions we receive at this stage already shows that they begin to understand the chart in detail. This part of the module takes one lecture. The next lecture is devoted to solving two problems that allow for using all the data sets and paths on the chart. The solutions are animated to help students decode the problem and show it on the chart. Interpolating data on a chart is also taught while solving the problems. The questions from the students are highly engaged and thoughtful. This is the benefit of using an active learning exercise for such a complex chart.
The details of applying this module is critical in its success. Every step is designed with a target ranging from building trust and engaging students to solving a complex problem that uses combination of thermodynamic paths and several data sets.
S. Kresta and I. Ayranci, 2018. Psychrometric charts in color: An example of active learning for chemical engineering students and faculty members. Education for Chemical Engineers, 22, pp. 14-19.